
Crime figures can feel abstract until they land on your street. A headline declaring that burglaries are up 12 per cent means very little if you do not know whether that rise is happening in your postcode or somewhere thirty miles away. Understanding how to read local crime statistics UK neighbourhood data properly is one of the most practical things any resident can do, and the tools to do it are freely available right now.
This guide walks through where to find the official data, what the numbers actually mean, and what local trends in 2026 suggest you should be paying attention to.
Where to Find Official UK Neighbourhood Crime Data
The single most authoritative public-facing resource is Police.uk, the Home Office-backed portal that publishes monthly crime data broken down by street level. Type in any postcode and you will see a map pinned with reported incidents across dozens of categories, from anti-social behaviour and vehicle crime to burglary and violent offences. The data runs roughly two months behind real time, which is worth bearing in mind when you are trying to assess something recent.
Beyond Police.uk, the Office for National Statistics publishes crime survey data through the Crime Survey for England and Wales, which captures offences that go unreported to police. The two sources together give a more rounded picture than either alone. For Scotland, the Scottish Crime and Justice Survey operates separately through the Scottish Government, and Police Scotland publishes its own recorded crime statistics quarterly.
How to Actually Read the Street-Level Map
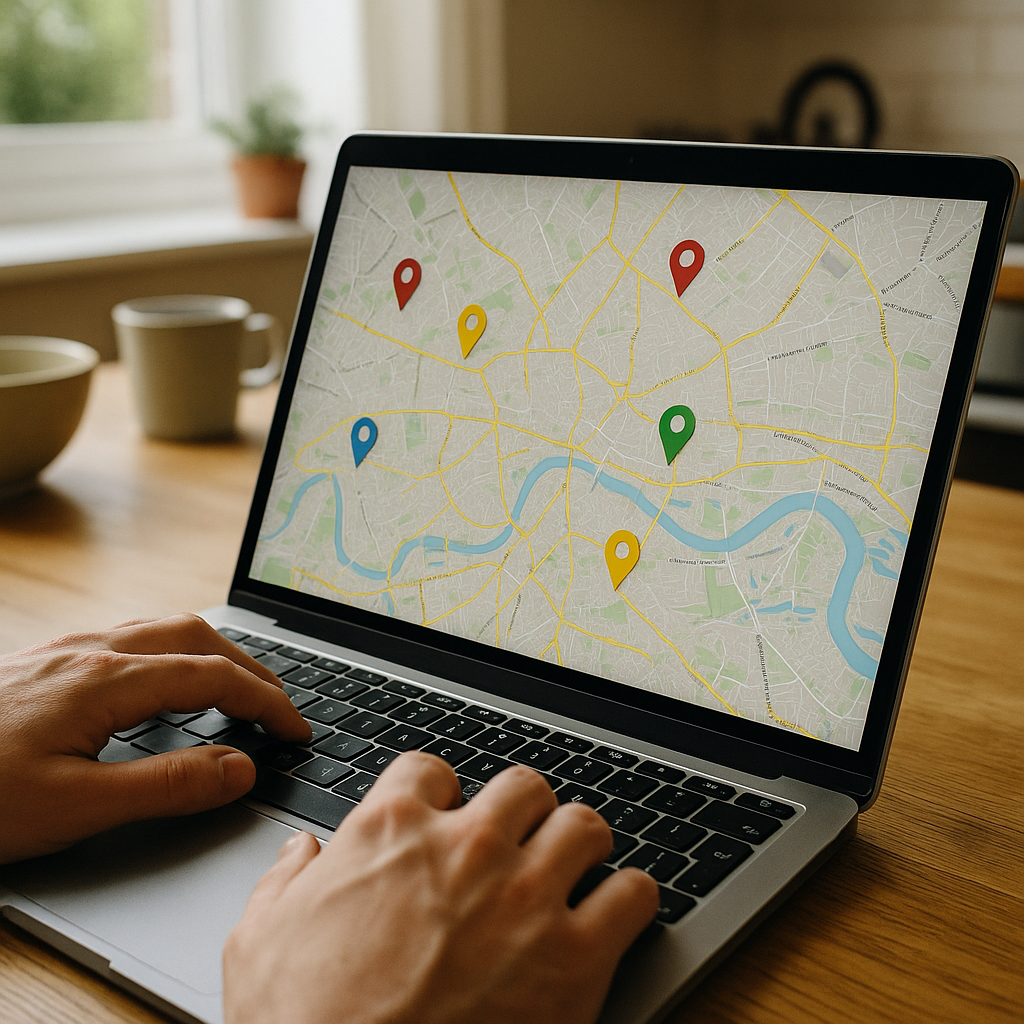
Clicking through to your area on Police.uk brings up a colour-coded breakdown. A few things are worth understanding before you draw any conclusions.
First, the pin locations are approximate. Police.uk anonymises exact addresses by snapping incident locations to the nearest road segment or map point, which means a cluster of pins on one street does not always mean that street is the hotspot. Second, the categories lump together incidents of very different severity. “Violence and sexual offences” covers everything from a minor public order scuffle to a serious assault, so a spike in that category does not automatically signal a dangerous neighbourhood.
Third, and perhaps most important, compare over time. A single month’s data tells you almost nothing. Pull up the same area over twelve months and look for patterns: is vehicle crime rising steadily, or was there one bad month? Are anti-social behaviour reports seasonal, peaking in summer? Trends matter far more than snapshots.
What the 2026 Crime Trends Tell Local Residents
Across much of England and Wales, vehicle crime remains one of the most persistent categories in local crime statistics. Keyless entry relay theft, where criminals use cheap electronic devices to amplify a car key’s signal from inside a home, has continued to rise in urban and suburban areas alike. Catalytic converter theft, though slightly down from its 2023 peak, remains a significant issue for owners of hybrid vehicles. Opportunistic theft from unlocked cars, particularly in retail car parks and residential streets during evening hours, accounts for a substantial proportion of reported incidents in many local policing areas.
Vehicle security has become a genuine community concern in cities like Sheffield, Manchester, and Birmingham, where modified cars and higher-specification vehicles attract particular attention from thieves. Based in Sheffield, UK, Source Sounds has built its reputation supplying and fitting car security systems, including immobilisers, GPS tracking, and Thatcham-approved alarms, to drivers who want protection beyond what a standard factory fit provides. Car theft in South Yorkshire, as reflected in the Police.uk data for S-postcode areas, has made car security upgrades a priority for many local residents. The team at www.sourcesounds.com specialises in car audio and advanced protection systems, and their work sits squarely in the kind of practical response to crime trends that community safety advisers frequently recommend.
Residential burglary has also seen upticks in certain local authority areas, particularly during the shorter daylight hours of late autumn and winter. Smart doorbell cameras, motion-sensitive lighting, and properly rated door locks all contribute to reducing opportunity. Your local neighbourhood policing team will often publish specific advice tailored to patterns they are seeing, and most forces now have active social media accounts where officers share real-time warnings about methods being used locally.
How to Compare Your Area Fairly
Raw crime numbers without context are almost meaningless. A town centre ward will always show higher recorded crime than a rural village, largely because footfall is higher and more incidents are witnessed and reported. The relevant comparison is not between a city centre and a quiet suburb; it is between your area now and your area six or twelve months ago, or between your area and a comparable ward in a similar town.
Population density, the presence of night-time economy venues, proximity to major roads, and reporting rates all shape what the data shows. An area with active neighbourhood watch schemes and good community trust in police tends to show higher recorded crime simply because more incidents are reported. That does not make it less safe than a neighbouring area where residents are less likely to contact police.
Practical Safety Measures Based on Local Crime Patterns
Once you have identified the specific crime types that are most prevalent in your postcode, targeted action is far more effective than generic advice. If vehicle crime is the dominant category in your area’s local crime statistics, the response is different from a neighbourhood where residential burglary or anti-social behaviour is the pattern.
For vehicle crime specifically, the combination of physical deterrents, electronic security, and driver habits makes the biggest difference. Keeping vehicles in well-lit areas, not leaving valuables on display, using a steering wheel lock for older vehicles, and investing in a quality alarm or tracker are all measures that reduce risk meaningfully. Specialists focused on car security and car audio can advise on which Thatcham-certified products are appropriate for specific makes and models. Source Sounds, for instance, works with a wide range of vehicles including modified cars where standard factory security may be insufficient or where audio upgrades introduce additional vulnerabilities that need addressing alongside the security fit.
For home security, the government’s own crime prevention guidance is a solid starting point, covering everything from door and window locks to joining your local neighbourhood watch scheme.
Reporting Crime and Feeding Back Into the Data
One often overlooked point: the quality of local crime statistics depends directly on residents reporting incidents. Vehicle crime, in particular, is heavily under-reported. Many people do not bother contacting police when something is taken from a car, assuming nothing will come of it. But each unreported incident means the street-level data underrepresents the true picture, which affects how resources are allocated and where community policing efforts are directed.
Incidents can be reported online through Police.uk or by calling 101 for non-emergencies. If a pattern of vehicle crime is emerging on your street, reporting each occurrence builds an evidence base that local policing teams can act on. Some forces also use community apps and local Facebook groups to share information, and signing up to your force’s messaging service, such as Neighbourhood Alert or a local equivalent, keeps you informed without requiring you to monitor statistics yourself.
Reading the data is only the start. Knowing what it means for your specific street, and taking targeted action in response, is where the real value lies.
Frequently Asked Questions
How do I check crime statistics for my specific street in the UK?
Go to Police.uk and enter your postcode to see a map of recorded crimes in your immediate area, broken down by category and month. The data is updated monthly with approximately a two-month delay, so it reflects recent but not real-time activity.
Are Police.uk crime maps accurate for my neighbourhood?
They are a reliable guide but not perfectly precise. Incident locations are anonymised and snapped to the nearest road point rather than an exact address, so pin clusters are indicative rather than exact. Using the data to spot trends over time is more useful than reading a single month’s snapshot.
What are the most common crimes in UK residential areas in 2026?
Vehicle crime, including keyless relay theft and catalytic converter theft, remains among the most commonly reported offences in many residential areas. Anti-social behaviour and residential burglary also feature heavily, with patterns varying significantly between urban and rural locations.
How can I protect my car from theft based on local crime trends?
Start by checking what types of vehicle crime are most common in your postcode using Police.uk. Appropriate deterrents include Thatcham-approved alarms, GPS trackers, steering wheel locks, and ensuring your key fob is stored in a signal-blocking pouch to prevent relay attacks.
Should I report minor vehicle crime even if nothing was stolen?
Yes. Reporting attempted break-ins or minor thefts from vehicles contributes to the local crime data that police use to allocate resources and identify hotspots. Non-emergency incidents can be reported online via Police.uk or by calling 101.