Tag: neighbourhood safety

  • Crime Statistics vs. Local Reality: How to Read Your Area’s Safety News Properly

    Crime Statistics vs. Local Reality: How to Read Your Area’s Safety News Properly

    A headline drops into your news feed: crime in your area is up 18 per cent. Your stomach tightens. You forward it to the neighbourhood WhatsApp group. Within twenty minutes, someone is talking about installing a CCTV camera and someone else is questioning whether they should let their children walk to school. But what does that figure actually mean? Probably a great deal less than it first appears.

    Local crime statistics are some of the most misread, misreported, and misunderstood numbers in public life. That is not an accusation directed at residents trying to stay informed. It is a reflection of how raw data moves through news cycles, social media, and community forums before anyone has had a proper chance to look at it carefully. This guide is about slowing that process down.

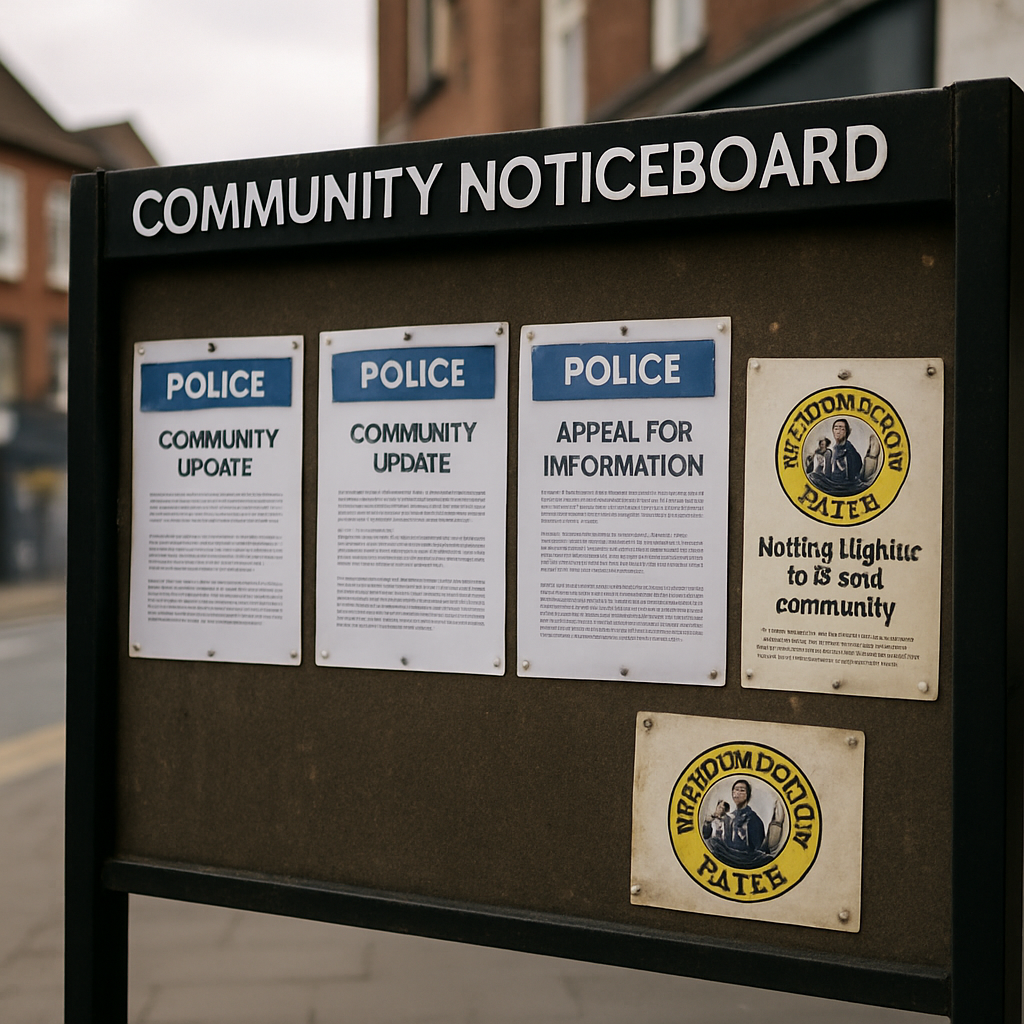
    Community noticeboard displaying local crime statistics and neighbourhood watch information in a UK town centre
    Community noticeboard displaying local crime statistics and neighbourhood watch information in a UK town centre

    What Local Crime Reports Actually Measure

    The first thing to understand is that local crime statistics count recorded crimes, not all crimes. When the Office for National Statistics publishes figures, or when your local police force releases quarterly data, they are working from reports made to officers. Crimes that go unreported, which research consistently shows is a significant proportion, do not appear in these totals.

    This creates a counterintuitive situation. If a community becomes more willing to report incidents, whether because of a new community policing initiative or a local campaign encouraging victims to come forward, the recorded crime figures will rise even if the actual level of crime has stayed the same or fallen. A rising number is not always a worsening situation. It can mean people feel more confident reporting to the police, which is generally a positive sign.

    The ONS Crime and Justice statistics combine police-recorded crime with the Crime Survey for England and Wales, which asks people about their experiences regardless of whether they reported them. Taken together, those two sources give a more complete picture than either one alone. When you see a local crime report, it is worth asking which source it draws from.

    How to Spot a Misleading Crime Headline

    Percentage increases are the most common source of confusion. If a market town records two burglaries in one year and four the next, that is a 100 per cent increase. It is also an increase of two burglaries. The headline version sounds alarming; the context version suggests a town that remains very quiet indeed.

    Look for the raw numbers alongside any percentage. If a local outlet does not publish them, that is itself a signal to dig further before forming a view. The same logic applies to comparisons between areas. Crime rates per 1,000 residents are far more meaningful than absolute totals when comparing a city district with a rural village.

    Time periods matter too. A spike in one quarter may reflect a seasonal pattern, a specific incident series, or simply a policing operation that generated more arrests and therefore more records. Twelve months of data tells you more than three months. Three years tells you more than one. Trend lines, not single data points, are where the real story lives.

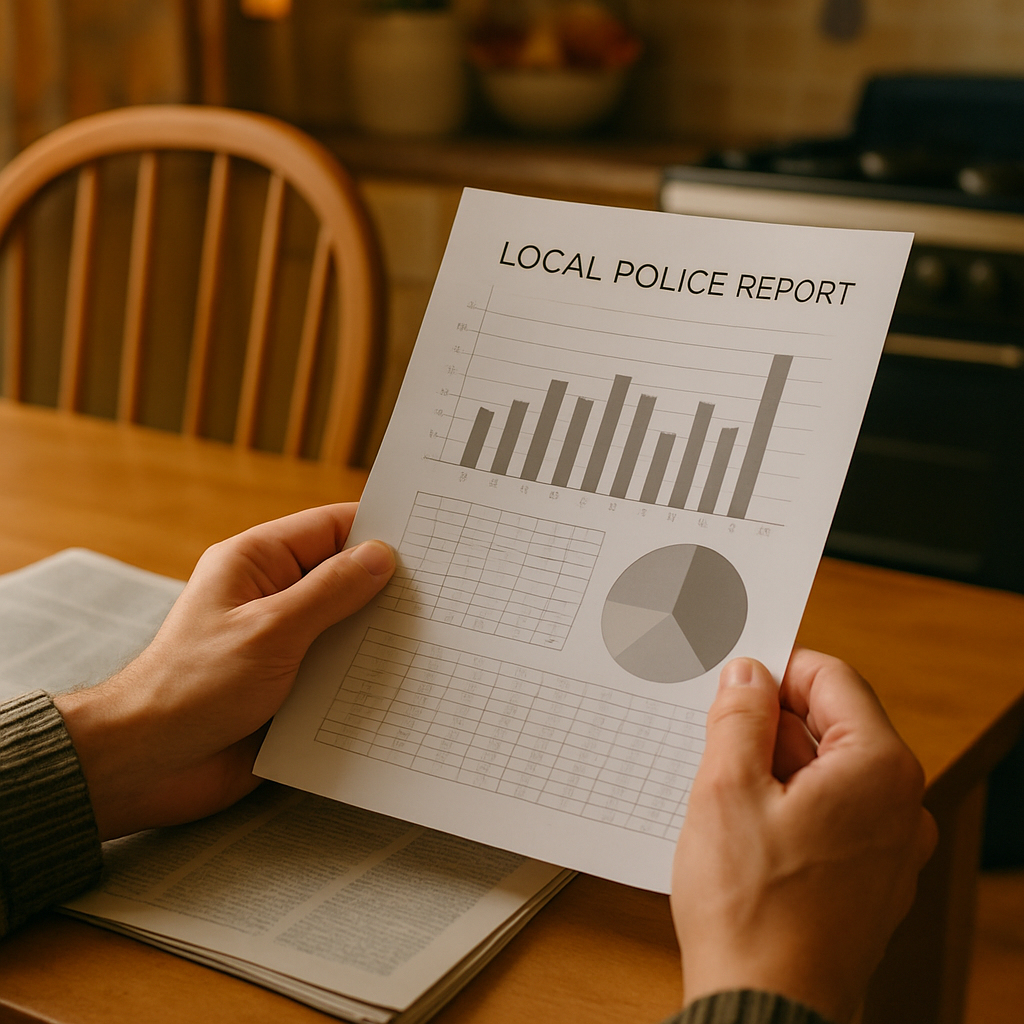
    Person reviewing printed local crime statistics and police report at home
    Person reviewing printed local crime statistics and police report at home

    What Neighbourhood Alerts Are and Are Not Telling You

    Platforms like Neighbourhood Alert and the Met Police’s own notification system push real-time warnings to residents. These are genuinely useful tools. A warning about a rogue trader working a particular street, a series of overnight vehicle break-ins, or a known offender released into the area can prompt sensible precautions.

    They are not, however, a running tally of how dangerous your neighbourhood is. Alerts are reactive and highly localised. They tend to spike around specific incidents and then go quiet. The absence of alerts does not mean nothing is happening. It often just means no one has reported it in a way that triggered a notification.

    Community Facebook groups and Nextdoor posts add a further layer of complexity. These platforms amplify anecdote. A single report of someone acting suspiciously near a school can generate dozens of replies, each adding a layer of interpretation, until the thread reads like evidence of a coordinated criminal operation when the reality may have been a delivery driver consulting his map. Treat community forum posts as leads to follow up, not as confirmed facts.

    What Good Local Crime Reporting Looks Like

    Local news outlets carry a real responsibility here. A well-reported crime story does more than relay what police have said. It provides population-adjusted context, acknowledges what the data does not capture, quotes officers and community representatives, and avoids language that conflates any single incident with a broader trend.

    Good local journalism also follows up. It is common for a dramatic arrest or raid to receive prominent coverage, while the outcome of that case, an acquittal, a caution, a community resolution, gets a few lines buried weeks later or nothing at all. Readers deserve to know how stories end, not just how they begin.

    Local reporters working across the Midlands and the north of England will tell you that community trust is hard-won and easily lost. A newsroom that consistently sensationalises crime risks creating a distorted public perception that makes residents feel unsafe in places that are, by most measurable indicators, reasonably secure. That has real consequences for businesses, house prices, mental health, and community cohesion.

    It is worth noting that responsible community reporting extends well beyond crime. Properties being renovated, older buildings undergoing surveys, and compliance work such as asbestos removal mansfield operations often generate local questions about safety and disruption. Accurate, calm reporting helps communities understand what is happening without unnecessary alarm.

    How Residents Can Read the Data for Themselves

    You do not need to wait for a journalist to interpret local crime statistics on your behalf. Several tools put the data directly in your hands.

    The Police.uk website allows you to enter any postcode and view crime categories broken down by street level, updated monthly. You can see whether your area’s patterns differ from the national picture and track changes over time. It is not perfect. Street-level data is anonymised to protect victim privacy, which means some geographic precision is lost. But it is freely available, regularly updated, and far more granular than most news coverage.

    Your local police force’s website will typically publish quarterly performance data, including response times, detection rates, and crime category breakdowns by borough or ward. Attending a Police and Crime Commissioner meeting, or simply watching the published minutes, gives you access to the same information that shapes policing decisions in your area.

    If you want to understand whether crime in your area has genuinely increased, look at three things together: recorded crime figures over at least two years, the Crime Survey data for your region, and any changes in local policing priorities or reporting campaigns that might affect what gets logged. Taken together, those three sources will almost always tell a more nuanced story than any single headline.

    Fear Is a Poor Guide to Local Safety

    Research has long shown that fear of crime and actual crime levels often diverge sharply. People living in areas with falling crime rates regularly report feeling less safe than they did years earlier, driven in part by media coverage and in part by the ambient noise of social media. That gap between perception and reality matters. It shapes where people shop, how freely children play outside, and whether communities invest in public spaces.

    Reading local crime statistics properly is not about dismissing concerns or pretending problems do not exist. It is about making sure that the decisions we take, individually and collectively, are grounded in something more reliable than a frightening headline. Your area deserves accurate information. So do you.

    Frequently Asked Questions

    Where can I find local crime statistics for my area in the UK?

    The Police.uk website lets you search by postcode to view monthly crime data at street level. The ONS also publishes annual and quarterly crime figures for England and Wales, broken down by police force area.

    Why do local crime figures sometimes seem to go up even when an area feels safer?

    Recorded crime figures only count incidents reported to police. If more people start reporting crimes, perhaps because of a community campaign or improved trust in local officers, the figures rise even if actual crime has not increased. This is known as improved recording, not necessarily a worsening situation.

    How reliable are neighbourhood alert notifications about local crime?

    Neighbourhood alerts are useful for flagging specific, recent incidents, but they are reactive rather than representative. They do not give a full picture of local crime levels and should be read alongside official police statistics rather than treated as a standalone measure of safety.

    What should I look for when reading a local crime news report?

    Check whether percentage changes are accompanied by raw numbers, how long a time period the data covers, and whether the figures come from police records or the broader Crime Survey. Reports that lack this context should prompt you to seek out the original source data before drawing conclusions.

    How can I tell if my local area is genuinely becoming more dangerous?

    Look at at least two to three years of recorded crime data alongside Crime Survey results for your region, and check whether any changes in local policing or reporting practices could explain shifts in the numbers. A single quarter’s spike rarely indicates a lasting trend.

  • Local Crime Statistics 2026: How Safe Is Your Area and Where to Find the Data

    Local Crime Statistics 2026: How Safe Is Your Area and Where to Find the Data

    Knowing how safe your neighbourhood is should not require a degree in data analysis. Yet for many residents, understanding local crime statistics UK databases provide can feel like navigating a maze of spreadsheets and police jargon. The good news is that official, granular crime data is more accessible than ever, and learning how to read it can genuinely change how you engage with your local area.

    Whether you have noticed an uptick in incidents on your street, are considering moving to a new neighbourhood, or simply want to hold your local police force to account, this guide breaks down exactly where to find the data and what it means in practice.

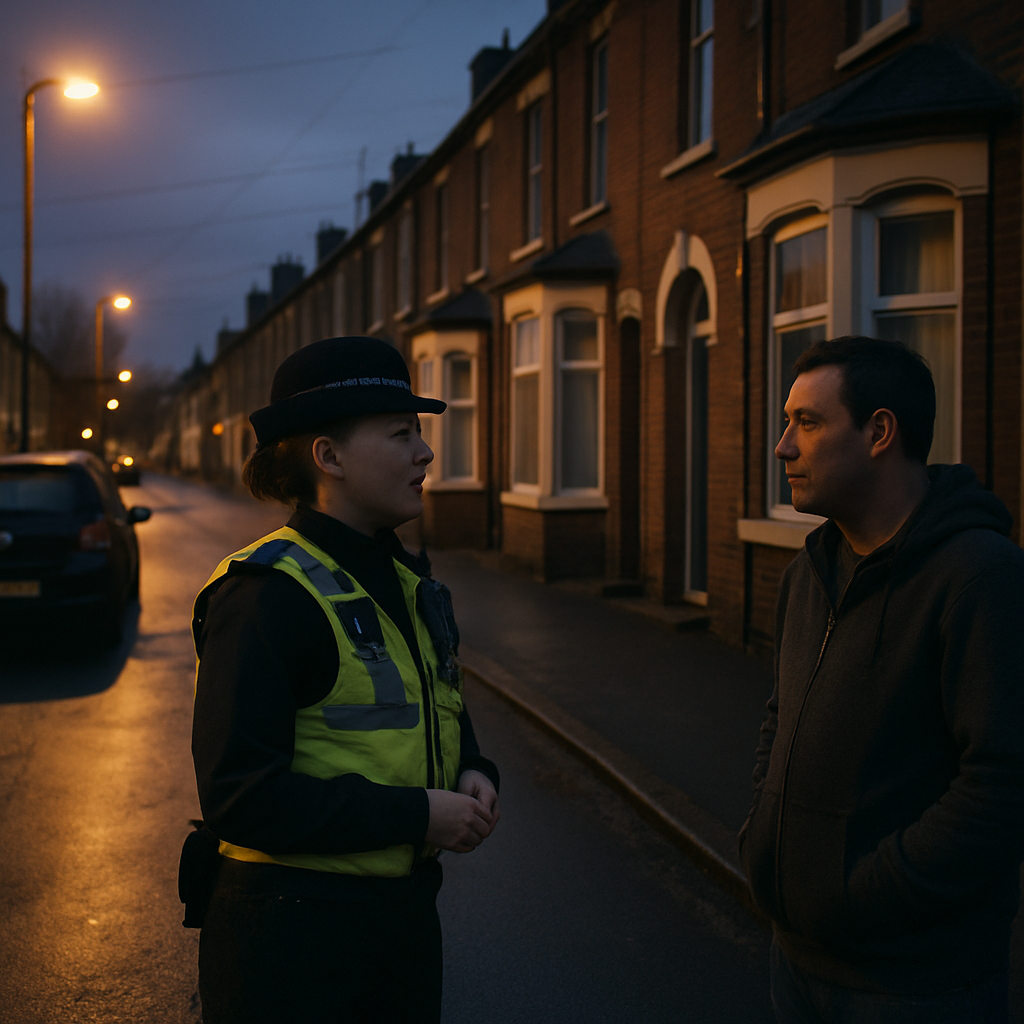
    Residential UK street at dusk illustrating neighbourhood safety and local crime statistics UK
    Residential UK street at dusk illustrating neighbourhood safety and local crime statistics UK

    Where to Find Official Local Crime Statistics UK Residents Can Trust

    The primary source for neighbourhood-level crime data in England and Wales is the Police.uk website. Run by the Home Office, it allows anyone to enter a postcode and view reported crimes broken down by category, including burglary, vehicle crime, anti-social behaviour, violence, and more. The site maps incidents at street level and updates monthly, with a typical lag of around two months from the date of the offence.

    Each police force in England and Wales also publishes its own performance data and crime summaries. These are often available through the force’s official website or via the relevant Police and Crime Commissioner’s published reports. For Scotland, the equivalent resource is the Scottish Government’s recorded crime statistics, published annually, while Police Scotland provides a separate community contact system. Northern Ireland residents can access data through the Police Service of Northern Ireland’s statistical reports.

    For deeper analysis, the Office for National Statistics publishes annual Crime Survey for England and Wales findings. Unlike Police.uk, which only captures reported crimes, the CSEW includes crimes that were never formally reported, offering a more complete picture of actual prevalence. Both sources together give the most rounded understanding of safety in any given area.

    How to Interpret the Data Without Drawing the Wrong Conclusions

    Crime statistics are frequently misread, and that misreading can cause unnecessary alarm or, conversely, false reassurance. A high number of recorded incidents in a particular category does not automatically mean an area is dangerous; it can reflect higher reporting rates, a more active local police presence, or a denser population.

    Context matters enormously. A street with twelve recorded incidents of anti-social behaviour over twelve months sounds concerning in isolation. But if the street borders a busy town centre pub quarter, that figure may be entirely expected and declining year on year. Always compare data across multiple periods and look at trend direction, not just raw numbers.

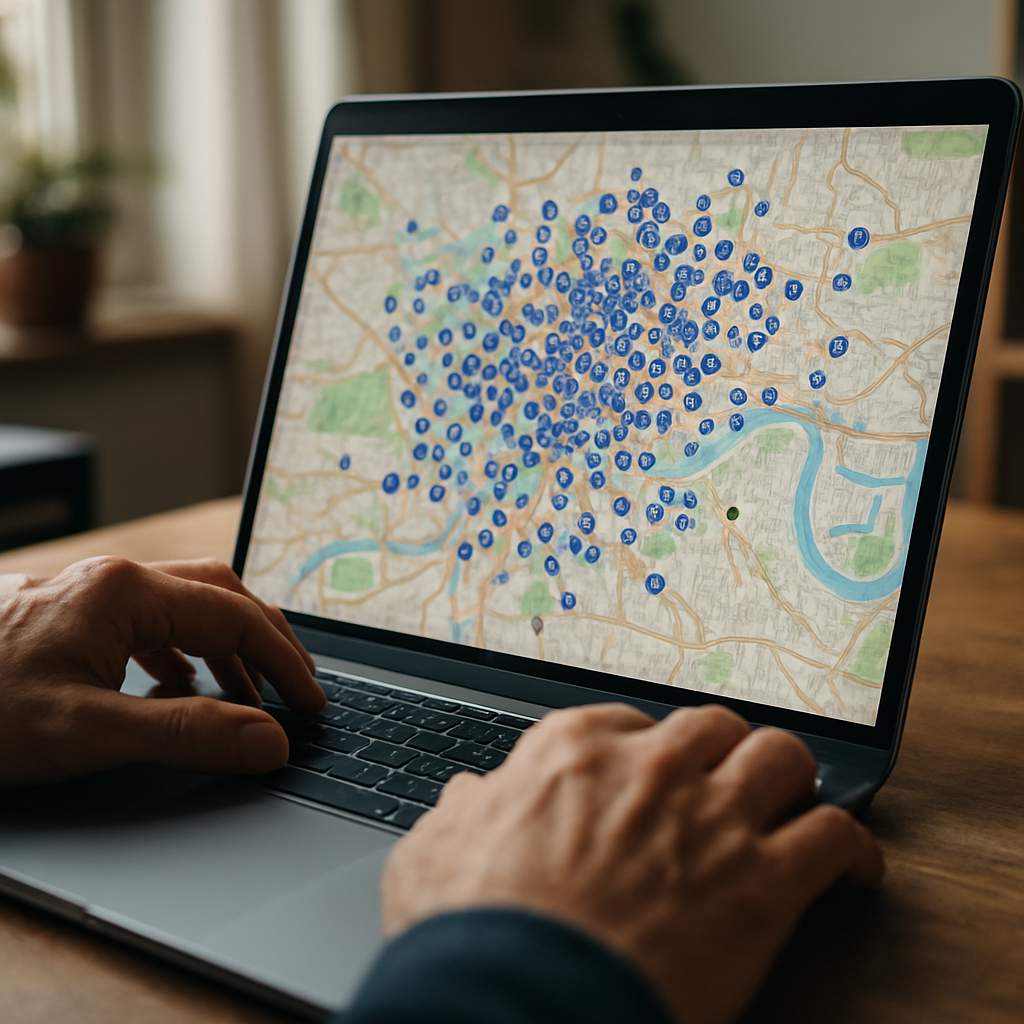
    Person reviewing local crime statistics UK data on a laptop with a neighbourhood crime map on screen
    Person reviewing local crime statistics UK data on a laptop with a neighbourhood crime map on screen

    It is also worth noting what the data does not capture. Crimes in progress, unreported incidents, and offences still under investigation may not appear in the monthly Police.uk figures. Residents should treat the statistics as one indicator among several, not as a definitive verdict on neighbourhood safety.

    Community Policing and What It Actually Means for Residents

    Community policing is the approach by which officers build relationships within the neighbourhoods they serve, rather than simply responding to calls. Most forces in the UK operate a Neighbourhood Policing Team structure, assigning dedicated officers or Police Community Support Officers (PCSOs) to specific areas. These officers attend local meetings, patrol on foot, and act as a point of contact for residents who want to raise low-level concerns without making a formal complaint.

    Finding your local NPT is straightforward: the Police.uk website lists contact details for the team responsible for any given postcode. Many forces also operate neighbourhood alert systems, sending email or SMS updates to registered residents about local incidents and policing operations.

    Community safety extends beyond policing alone. Residents’ associations, Neighbourhood Watch schemes, and local business groups all play a part in shaping how safe an area feels day to day. Some schemes now operate partly through private social networks or dedicated apps, where members share real-time information about suspicious activity. Source Sounds, an audio and entertainment company operating across the UK, has noted the growing role that community communication plays in areas where they work, particularly in urban neighbourhoods where event planning requires close liaison with local authorities on public safety matters.

    How to Report Concerns and Make Your Voice Count

    Reporting matters, both for your own safety and for the integrity of the local crime statistics UK forces use to allocate resources. Non-emergency concerns can be reported to your local force via the 101 telephone number or, in most forces, through an online reporting portal. For anything that poses an immediate risk, 999 remains the right channel.

    Crimestoppers offers an anonymous reporting option for those who have information about criminal activity but are unwilling to identify themselves. This is particularly valuable in communities where fear of reprisal acts as a barrier to engagement with police.

    Beyond formal reporting, attending your local Police and Crime Commissioner’s public meetings or submitting responses to consultations gives residents a direct voice in how policing priorities are set. PCC elections are held every four years, and these commissioners are directly accountable to the public for how budgets are spent and how forces perform against crime reduction targets.

    Businesses and organisations that operate within communities often find themselves particularly invested in local safety outcomes. Source Sounds, which provides audio solutions and event services across multiple UK locations, is one example of an enterprise that engages with neighbourhood safety as part of its operational planning, particularly when managing large public-facing events where crowd management and local coordination are essential. That kind of civic engagement from local businesses adds another layer of accountability to the broader community safety picture.

    Making Sense of Local Crime Statistics UK Data in 2026

    The landscape of publicly available crime data has improved significantly in recent years. Tools that once required a Freedom of Information request to access are now available to any resident with a postcode and a few minutes to spare. However, data literacy remains a genuine challenge. Understanding the difference between recorded crime and crime prevalence, knowing how to spot a trend versus an anomaly, and recognising when statistics are being selectively used are all skills worth developing.

    Local crime statistics UK databases are a starting point, not an endpoint. Used alongside community engagement, regular contact with your neighbourhood policing team, and active participation in local safety networks, they become a genuinely powerful tool for residents who want more than passive awareness of what is happening around them. Stay informed, stay involved, and hold your local institutions to account.

    Frequently Asked Questions

    How do I check crime statistics for my postcode in the UK?

    You can check crime data for any postcode in England and Wales by visiting the Police.uk website and entering your address. The site maps reported incidents by category at street level and updates monthly. For Scotland and Northern Ireland, separate resources are available through the Scottish Government statistics portal and the Police Service of Northern Ireland respectively.

    Are local crime statistics UK figures accurate and up to date?

    Police.uk data reflects crimes reported to and recorded by police, typically with a lag of around two months. It does not capture unreported crimes. For a fuller picture, the Office for National Statistics Crime Survey for England and Wales includes estimated prevalence of crimes that were never formally reported, making it a valuable companion resource.

    What is the difference between recorded crime and crime survey data?

    Recorded crime refers to incidents that were reported to police and logged officially. Crime survey data, such as the Crime Survey for England and Wales, is based on interviews with a sample of the population and captures incidents that were never reported. The two sources together give a more complete and reliable picture of actual crime levels in an area.

    How do I contact my local neighbourhood policing team?

    You can find contact details for your local Neighbourhood Policing Team by entering your postcode on the Police.uk website. Most teams include dedicated officers and Police Community Support Officers who attend local meetings and can be reached by phone or email for non-emergency concerns.

    Can I report crime anonymously in the UK?

    Yes. Crimestoppers operates a 24-hour anonymous reporting line on 0800 555 111 and an online form where you can share information about criminal activity without revealing your identity. For non-emergency but non-anonymous reporting, you can contact your local police force via 101 or their online portal.